Walt Disney's Financial Analysis and Financial Ratios
Quality Business Consultant's financial analysis expert, Paul Borosky, MBA., doctoral candidate, and published author, has created proprietary financial models to help analyze Disney's financial performance using Disney's summarized income statements and balance sheets for the last five years, 2016 to 2020, found in their Annual Reports and Disney's 10ks.
Further, our financial model also calculates over 20 popular financial ratios, such as Disney's current ratio, return on equity, and debt ratio. This information is the basis of our financial report, "Walt Disney Financial Report", where we offer insights into understanding Disney's financial standing through insightful financial analysis.
A Beginner's Guide to Walt Disney Financial Analysis - 2021
- Included Easy to download PDF File.
- Included Easy to use format.
- Included Summarized Income Statements and Balance Sheets for the last 5 years..
- Included Popular financial ratios for the last 5 years included... with calculations and formulas!
- Included Expert tips to help with financial statements analysis.
- Included Expert tips to help with financial ratios analysis.
- NOT Included-Identify and discuss financial trends for the company..
- NOT Included-Expert financial analysis done by Paul Borosky, MBA.
- NOT Included- Analyst "Letter Grades" for the company's ratios.
Walt Disney Financial Report by Paul Borosky, MBA. - 2020
- Included Easy to download PDF File.
- Included Easy to use format.
- Included Summarized Income Statements and Balance Sheets for the last 5 years..
- Included Popular financial ratios for the last 5 years included... with calculations and formulas!
- Included Expert tips to help with financial statements analysis.
- Included Expert tips to help with financial ratios analysis.
- Included Identify and discuss financial trends for the company.
- Included Expert financial analysis done by Paul Borosky MBA.
- Included Analyst "Letter Grades" for the company's ratios (Starting in 2021).
Disney's Financial Report and Annual Report

Click Below for the CURRENT
Downloadable PDF Price!!
Disney's 2021 Beginner's Guide
Table of Contents
- Disclaimer 3
- Forward 4
- Income Statement 6
- Disney’s Summarized Income Statements 6
- Revenues 7
- Cost of Goods Sold (COGS) 8
- Selling, General, and Administrative Expenses (SG&A 8
- Research and Development (R&D) 9
- Operating Expenses 10
- Earnings Before Interest and Taxes (EBIT 10
- Interest Expense 11
- Earnings Before Taxes (EBT) 12
- Taxes 12
- Net income 12
- Tax Rate 13
- Balance Sheet 15
- Disney’s Summarized Balance Sheets 15
- Cash 16
- Short-Term Investments 17
- Accounts Receivables 17
- Inventory 18
- Current Assets 19
- Property, Plant, and Equipment (PP&E) 20
- Total Assets 20
- Accounts Payable 21
- Accrued Expenses 22
- Short-Term Debt 23
- Total Current Liabilities 24
- Long Term Debt (LT Debt) 25
- Total Liabilities 26
- Common Stock and Additional Paid-in Capital 27
- Treasury 27
- Retained Earnings 28
- Total Equity 29
- Financial Ratios 30
- Disney’s Liquidity Ratios 31
- Current Ratio 31
- Quick Ratio 32
- Cash Ratio 33
- Disney’s Asset Ratios 35
- Total Asset Turnover 36
- Fixed Asset Turnover 37
- Days Sales Outstanding 37
- Inventory Turnover 38
- Accounts Receivable Turnover 39
- Accounts Payable Turnover 40
- Other Asset Ratio Calculations 41
- Working Capital Turnover 41
- Average Days in Inventory 41
- Average Days Payable 41
- Disney’s Profitability Ratios 43
- Return on Assets (ROA) 43
- Return on Equity (ROE) 44
- Net Profit Margin 45
- Gross Profit Margin 46
- Operating Profit Margin 46
- Disney’s Debt Ratios 48
- Debt Ratio 48
- Debt to Equity Ratio 49
- Times Interest Earned 50

Click Below for the CURRENT
Downloadable PDF Price!!
Disney's 2020 Financial Report
Table of Contents
- Disclaimer 3
- Acknowledgments 4
- Forward 5
- About the Author 7
- Company Summary 8
- Financial Statement Introduction 11
- Income Statement 12
- Disney’s Income Statement – Summary Analysis 13
- Income Statement Discussion 15
- Balance Sheet 24
- Balance Sheet – Summary Analysis 25
- Balance Sheet Discussion 28
- Financial Ratios 43
- Liquidity Ratios 44
- Liquidity Ratios - Summary Analysis 44
- Liquidity Ratios Discussion 45
- Current Ratio 45
- Quick Ratio 46
- Cash Ratio 47
- Other Liquidity Ratios 48
- Net Operating Working Capital 48
- Asset Ratios 49
- Asset Utilization Ratios - Summary Analysis 50
- Asset Utilization Ratios Discussion 52
- Total Asset Turnover 52
- Fixed Asset Turnover 52
- Days Sales Outstanding 53
- Inventory Turnover 54
- Accounts Receivable Turnover 55
- Accounts Payable Turnover 56
- Other Asset Ratio Calculations 56
- Working Capital Turnover 56
- Average Days in Inventory 57
- Average Days Payable 57
- Profitability Ratios 58
- Profitability Ratios - Summary Analysis 59
- Profitability Ratios Discussion 60
- Return on Assets (ROA) 60
- Return on Equity (ROE) 61
- Profit Margin 62
- Gross Profit Margin 62
- Operating Profit Margin 63
- Basic Earnings Power 64
- ROCE 64
- Capital Employed 64
- Debt Ratios 65
- Disney’s Debt Ratios - Summary Analysis 65
- Debt Ratios Discussion 66
- Long-Term Debt Ratio 66
- Debt to Equity Ratio 67
- Times Interest Earned 67
- WACC 69
- Book Value of WACC 69
- Free Cash Flow (FCF) 71
- Free Cash Flows – 2015 - 2019 71
- Free Cash Flows – 5 Year Projections 72
- Income Statement – Projections for 5 years 73
- Income Statement – 5 Year Projections 73
- Balance Sheet – Projections for 5 years 74
- Balance Sheet – 5 Year Projections 74
- Company Valuation and Intrinsic Stock Price 76
- Appendix 1: Summarized Income Statement 77
- Appendix 2: Income Statement – Percent of Sales 78
- Appendix 3: Income Statement – Year over Year Growth 79
- Appendix 4: Summarized Balance Sheet 80
- Appendix 5: Balance Sheet as Percent of Total Assets 82
- Appendix 6: Summarized Financial Ratios 83
Disney's Financial Report by Paul Borosky, MBA.
Hey All,
Thanks for considering my Walt Disney Financial Report. In this report, you will be able to find preliminary information about Apple's current financial performance as well as some historical track records and trends. Also, in this report, written by myself, Paul Borosky, MBA., Doctoral Candidate and published author, you will find:
- Summarized income statement for the last 5 years.
- Summarized balance sheet for the last 5 years.
- Summary analysis by myself of the important income statement, balance sheet, and financial ratio trends and other happenings.
- Five years’ worth of over twenty common financial ratios presented with formulas, calculations, and analysis tips for each ratio.
- Line by line description, explanation, and analysis tip for most financial statement line items and financial ratios.
- Professional financial analysis tips are provided in each section to help YOU conduct your OWN financial analysis!
- Each section includes an “in other words” segment. This is where I use plain English to explain concepts.
Sincerely,
Paul, MBA.
Sample Report


Walt Disney's Income Statement Analysis Sample
In this section of the financial report, I walk you through a broad definition as to what an income statement is and why it is important. From this, I then discuss and define important income statement line items, such as revenues, gross profits, etc. in detail. Finally, I offer a summary analysis of the company's important income statement line item trends. For example,...
Disney's Cost of Goods Sold.
Disney's cost of goods sold ended in 2016 at $29.9 billion. In the next four years, the organization's cost of goods would continuously increase, ending 2020 at $43.8 billion. As compared to revenues, Disney's cost of goods sold was 53.9% in 2016. In the next four years, the company's cost of goods sold as compared to revenues would steadily increase, ending 2020 at 67.1%. On average, the organization's cost of goods sold has increased by 10.5% annually in the last five years.
Disney's 2021 Summary Income Statement |
|||||
| Column1 |
2021 |
2020 | 2019 | 2018 |
2017 |
| Revenues |
67,418 |
65,388 | 69,607 | 59,434 |
55,137 |
| COGS |
45,131 |
43,880 | 42,018 | 32,726 |
30,306 |
| Gross Profit |
22,287 |
21,508 | 27,552 | 26,708 |
24,831 |
| SG&A |
13,517 |
12,369 | 11,549 | 8,860 |
8,176 |
| Depreciation |
5,111 |
5,345 | 4,167 | 3,011 |
2,782 |
| R & D | - | - | - | - | - |
| Other | - | - | - | - | - |
| Total Operating Expenses |
18,628 |
17,714 | 15,716 | 11,871 |
10,958 |
| EBIT |
3,967 |
(252) | 14,459 | 14,837 |
13,873 |
| Other Income | - | - |
601 |
78 |
|
| Interest Expense |
1,406 |
1,491 | 978 | 574 |
385 |
| EBT |
2,561 |
(1,743) | 13,923 | 14,729 |
13,788 |
| Taxes |
25 |
699 | 3,026 | 1,663 |
4,422 |
| Net Income |
2,507 |
(2,474) | 11,584 | 13,066 |
9,366 |
Disney's Balance Sheet Analysis Sample
In this section of the financial report, I walk you through a broad definition of what a balance sheet is and why it is important. From this, I then discuss and define important balance sheet line items, such as cash, inventory, etc., in detail. Finally, I offer a summary analysis of the company's important balance sheet line item trends. For example,...
Disney's Property, Plant, and Equipment
The Walt Disney Company's property, plant, and equipment ended 2016 at $27.3 billion. In the next four years, the organization's property, plant, and equipment would grow substantially, ending 2020 at $32 billion.
The substantial growth in property, plant, and equipment indicates that executives for Disney anticipate sustained revenue growth for the long-term. From an investor's perspective, this should give the stakeholders a moderate feeling of confidence in knowing that executives have faith in the organization's ability to grow. However, the substantial growth in fixed assets like property, plant, and equipment does leave the organization vulnerable to unanticipated revenue declines. A better strategy may be for the organization to rein in their fixed asset growth until optimization is achieved with their current fixed assets.
Disney's 2021 Summary Balance Sheet |
|||||
| Column1 |
2021 |
2020 | 2019 | 2018 |
2017 |
| Cash |
15,959 |
17,914 | 5,418 | 4,150 |
4,017 |
| Short Term Investment | - | - | - | ||
| Account Receivable |
13,367 |
12,708 | 15,418 | 9,334 |
8,633 |
| Inventory |
1,331 |
1,583 | 1,649 | 1,392 |
1,373 |
| Other | - | - | - | - | - |
| Current Assets |
33,657 |
35,251 | 28,124 | 16,825 |
15,889 |
| Net PPE |
26,972 |
26,594 | 26,174 | 24,474 |
25,006 |
| Goodwill |
78,071 |
77,689 | 80,293 | 31,269 |
31,426 |
| Other | - | - | - | - | - |
| Total Assets |
203,609 |
201,549 | 193,984 | 98,598 |
95,789 |
| Accounts Payable |
20,894 |
16,801 | 17,942 | 9,479 |
8,855 |
| Accrued Expense | - | - | - | - | - |
| Accrued Taxes | - | - | - | - | - |
| Notes Payable | - | - | - | - | - |
| LT Debt - Current |
5,866 |
5,711 | 8,857 | 3,790 |
6,172 |
| Other | - | - | - | - | - |
| Total Current Liabilities |
31,077 |
26,628 | 31,521 | 17,860 |
19,595 |
| LT Debt |
48,540 |
52,917 | 31,521 | 17,084 |
19,119 |
| Other | - | - | - | - | - |
| Total Liabilities |
110,598 |
113,286 | 100,095 | 45,766 |
50,785 |
| Common Stock |
55,471 |
54,497 | 53,907 | 36,779 |
36,248 |
| Treasury |
907 |
907 | 907 | 67,588 |
64,011 |
| Retained Earnings |
40,429 |
38,315 | 42,494 | 82,679 |
72,606 |
| Other | - | - | - | - | |
| Total Equity |
93,011 |
88,263 | 93,889 | 52,832 |
45,004 |
| Total Equity & Liability |
203,609 |
201,549 | 193,984 | 98,598 |
95,789 |
Disney's Financial Ratios Sample
In this section of the financial report, I walk you through definitions of various popular financial ratios, how to calculate the ratios, formulas used, etc. Also, for some popular financial ratios, I provide brief explanations of what the ratios mean as it is related to the company.
Disney's Quick Ratio
Disney's quick ratio ended 2016 at .92. In the next three years, the organization would reduce its quick ratio to .84 in 2019. However, in 2020, the organization substantially increased its quick ratio ending the year at 1.2.
Disney's Fixed Asset Turnover Ratio
In 2016, Disney's fixed asset turnover was 2.03. In the next year, the organization's fixed asset turnover would fall to 1.9. Fortunately, in the next three years, the organization's fixed asset turnover would rebound, ending 2020 at 2.04.
Disney's Return on Equity
Disney's return on equity ended 2016 at 20.6%. In the next two years, the organization's return on equity would increase substantially, ending 2018 at 24.3%. However, the organization's return on equity would continue to fall over the last two years ending 2020 at -2.8%.
Disney's Liquidity Ratios |
||
| Ratios | 2021 | 2020 |
| Current Ratio | 1.08 | 1.32 |
| Cash Ratio | 0.51 | 0.67 |
| Quick Ratio | 1.04 | 1.26 |
| Net Working Capital | 2,580 | 8,623 |
Disney's Asset Utilization |
||
| Ratios | 2021 | 2020 |
| Total Asset Turnover | 0.33 | 0.32 |
| Fixed Asset Turnover | 2.50 | 2.46 |
| Days Sales Outstanding | 70.58 | 78.50 |
| Inventory Turnover (Using Sales) | 46.27 | 40.46 |
| Inventory Turnover (Using COGS) | 30.98 | 27.15 |
| Accounts Receivable Turnover | 5.17 | 4.65 |
| Working Capital Turnover | 26.13 | 7.58 |
| AP Turnover | 2.38 | 2.52 |
| Average Days Inventory | 11.78 | 13.44 |
| Average Days Payable | 153.29 | 144.72 |
Disney's Profitability Ratios |
||
| Ratios | 2021 | 2020 |
| Return on Assets | 1.23% | -1.23% |
| Return on Equity | 2.70% | -2.80% |
| Net Profit Margin | 3.72% | -3.78% |
| Gross Profit Margin | 33.06% | 32.89% |
| Operating Profit Margin | 5.88% | -0.39% |
| Basic Earning Power | 1.95% | -0.13% |
| ROCE | 2.30% | -0.14% |
| Capital Employed | 172,532 | 174,921 |
| ROIC | 2.66% | -0.24% |
Disney's Debt Ratios |
||
| Ratios | 2021 | 2020 |
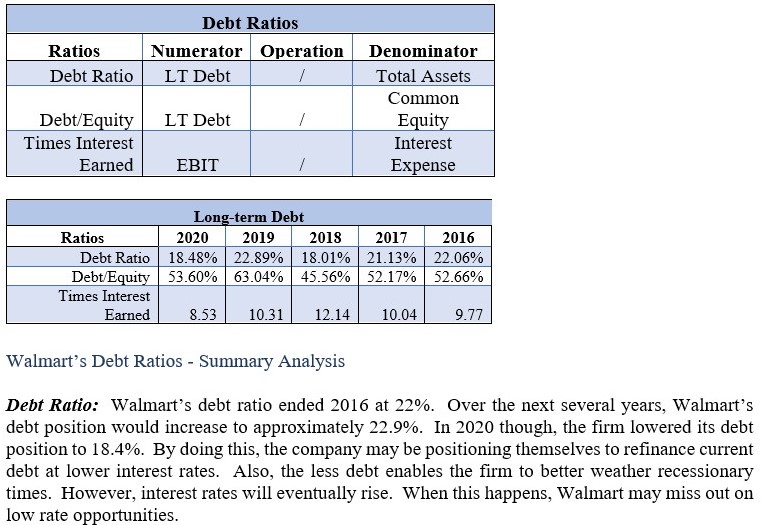
| Debt Ratio | 26.72% | 29.09% |
| Debt/Equity | 58.49% | 66.42% |
| Times Interest Earned | 2.82 | (0.17) |